


Sydney’s housing market has crossed a line. And there is no affordable side left.
For decades, Sydney’s housing conversation revolved around where affordability still existed. The outer suburbs. The fringe. The next ring out.
That question no longer holds.
New research from Airteam, conducted in collaboration with Primara Research, finds that not a single one of Sydney’s 301 analysed regions now meets standard affordability benchmarks.
More confronting still, 55% of the city is now classified as “impossibly unaffordable”, the most severe category on the scale. Five years ago, that figure was 39%.
This is not a marginal deterioration. It is a structural shift.
What the data shows is a housing market that has moved beyond pockets of stress and into a city-wide condition, where affordability is no longer something households can realistically chase. It is something they are increasingly priced out of altogether.
From pressure to permanence. How unaffordability spread across the city
And affordability has not just worsened. It has spread.
Across Sydney, 73% of regions became more unaffordable over the past five years, pushing once-accessible areas into the same category as the traditionally expensive inner city and coastal zones.
The concentration is stark:
- Northern Beaches: 89% impossibly unaffordable
- Eastern Suburbs: 80% impossibly unaffordable
- North Shore: 63% impossibly unaffordable
- South West: 62% impossibly unaffordable
- Sutherland: 60% impossibly unaffordable
At the suburb level, Putney records the highest unaffordability rating at 26.9, on a scale where 9 or above is already considered impossibly unaffordable.
Even the Outer South West, now the least impossibly unaffordable region in Sydney, contains zero affordable suburbs.
The idea of a geographic escape hatch has disappeared.
Population growth has accelerated the problem.
As affordability collapsed closer to the city, households moved outward. That migration, in turn, drove prices higher in the very regions meant to absorb pressure.
The four fastest-growing outer regions now account for 30% of Sydney’s population, up from 28% five years ago. Every one of them saw sharp rises in unaffordability over the same period.
- Blacktown shifted from 0% impossibly unaffordable to 43%.
- Baulkham Hills and Hawkesbury climbed from 39% to 53%.
- South West Sydney rose from 38% to 62%.
- Outer South West went from 0% to 20%.
Box Hill captures the dynamic most clearly.
Its population surged from 1,647 in 2018 to 22,420 today, a fourteen-fold increase. Over the same period, its unaffordability rating jumped from 5.6 to 8.3, racing toward the impossibly unaffordable threshold.
Only one area moved in the opposite direction.
Schofields-East improved from seriously to moderately unaffordable, triggering a 71% population increase in five years as buyers rushed in. Even there, affordability remains out of reach by traditional standards.
What we are no longer debating matters most
“The significance of the problem can be seen in what we’re not discussing,” says Peter Drennan, Head of Research and Data at Primara Research.
“We aren’t discussing how much of Sydney is affordable, none of it is. We are discussing how much of it is now at the maximum level, impossibly unaffordable. And the majority of it is.”
That shift in language is telling.
Affordability has moved from a spectrum to a ceiling. The debate is no longer about gradients of access. It is about how much of the city has hit the upper bound of financial strain.
Rich Atkinson, Executive Director of Airteam, puts the trajectory plainly: “Sydneysiders are dedicating a fundamentally unsustainable proportion of their real wages to housing compared to the rest of the world. The impossibly unaffordable portion of Sydney jumped from 39% to 55% in just five years. People are being pushed further afield, but they’re not finding relief, they’re finding the same crisis in new locations.”
The affordability illusion of the fringe
Outer regions continue to grow, but not because they are affordable. They grow because there is nowhere else to go.
Baulkham Hills now sits at 65% impossibly unaffordable.
Blacktown is 42% impossibly unaffordable and 48% severely unaffordable.
The pattern is consistent. Buyers chase relative affordability. Demand concentrates. Prices rise. The next wave is forced even further out.
“The pattern is clear and devastating,” Atkinson says.
“Buyers chase affordability to the fringe, drive prices impossibly high, then the next wave is forced even further out. We’re not solving Sydney’s housing crisis, we’re systematically spreading it across the entire metropolitan area.”
A city past the tipping point
This research does not suggest Sydney is approaching an affordability crisis - and nobody is suggesting that. It indicates the city has already entered a new phase.
When zero regions meet affordability standards, the issue stops being cyclical or localised. It becomes structural.
Sydney is no longer sorting households by preference or proximity. It is sorting them by tolerance for financial strain.
And that is a far harder problem to unwind.
About the Data
The data analysed by Airteam in conjunction with Primara Research uses multiple sources to build an affordability index and track population growth.
Data is sourced from the Australian Bureau of Statistics, including population data, wage price index data, and census data by SA2, SA3, and SA4 levels as at the latest data at June 2024.
The analysis also incorporates property price data from the NSW Valuer General.
The affordability index applies measures consistent with the 2024 Demographia report on international affordability. SA2 regions were excluded from the analysis where annual sales totalled 25 or fewer, ensuring consistent average index numbers.
Update

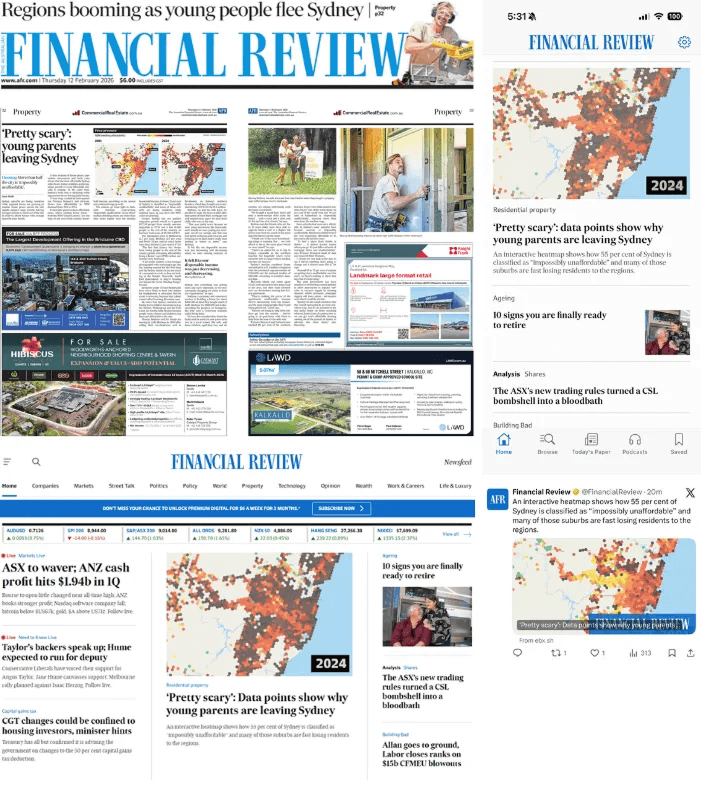
We were excited when the Australian Financial Review asked us to help them surface our research, analysis and mapping. It’s confronting, but essential reading.

Australia's trusted software development partner


